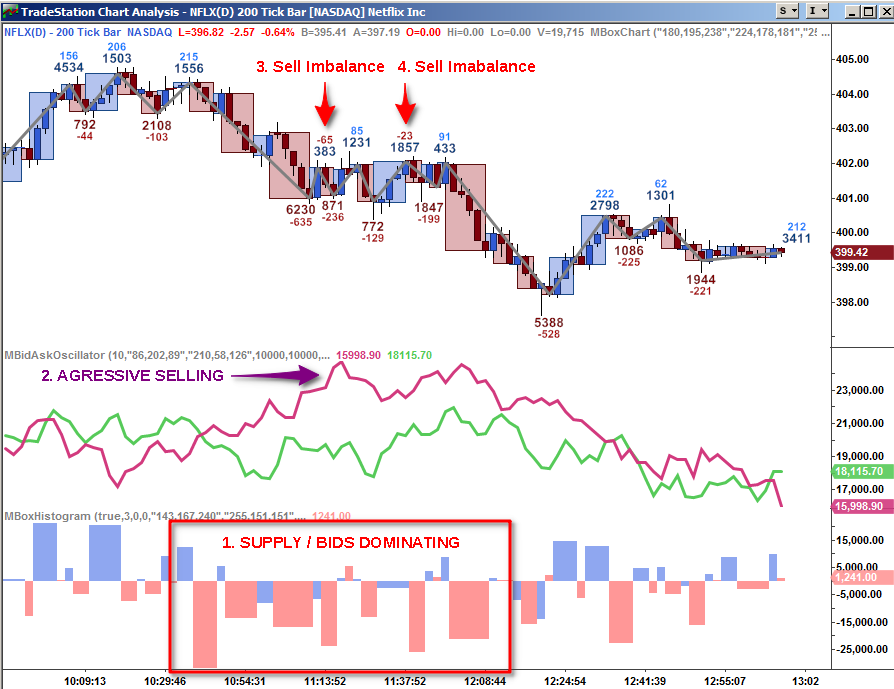
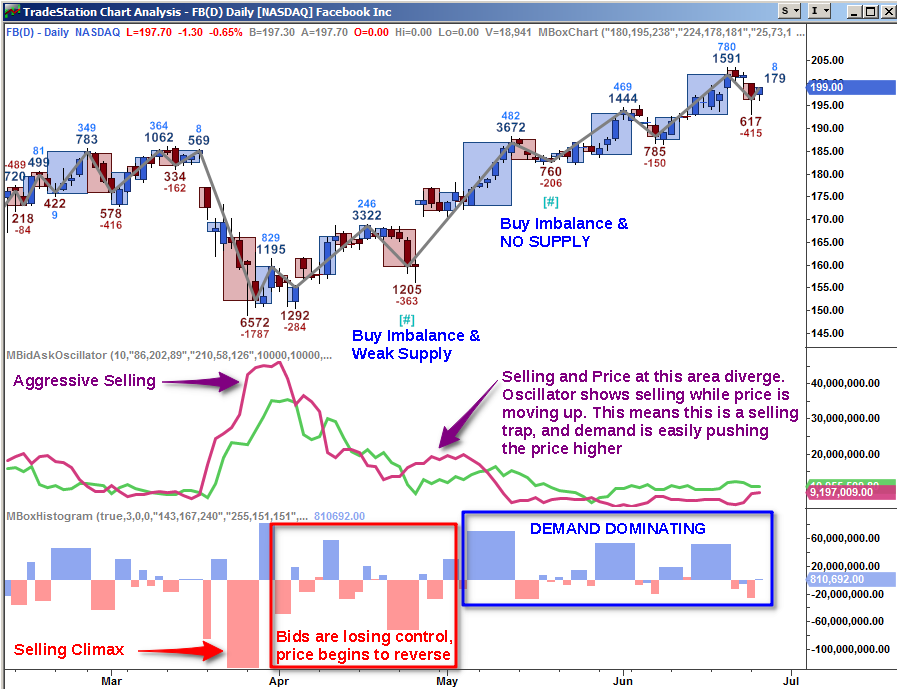
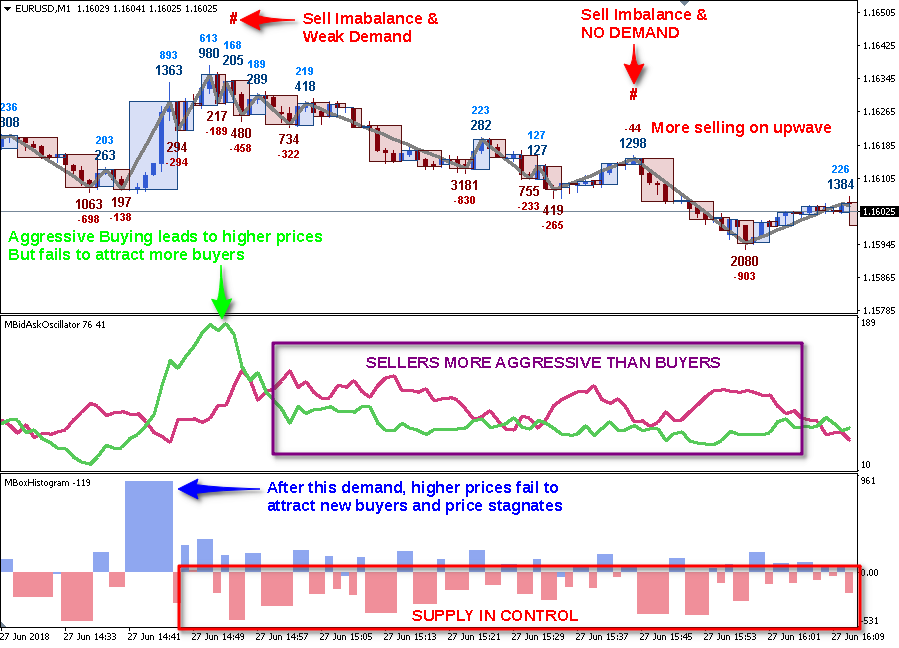
MBidAskOscillator IndicatorThe MBidAskOscillator separates volume into trades executed at the best bid price and trades executed at the best ask price. This indicator gives you insight into the market action because you can see whether sellers are aggressive or buyers are aggressive. Use Cases 1. When the Bid / Ask Lines have a wide gap, this shows which side is dominating. 2. When a Bid / Ask Line is low, you can spot areas of NO SUPPLY / NO DEMAND. 3. When either the Bid / Ask Line diverges from Price (meaning going in opposite direction), get ready for a change in trend. Can be very powerful! 4. When the Bid / Ask Lines cross, this shows the shift between Buyers / Sellers trying to move price in their direction. |
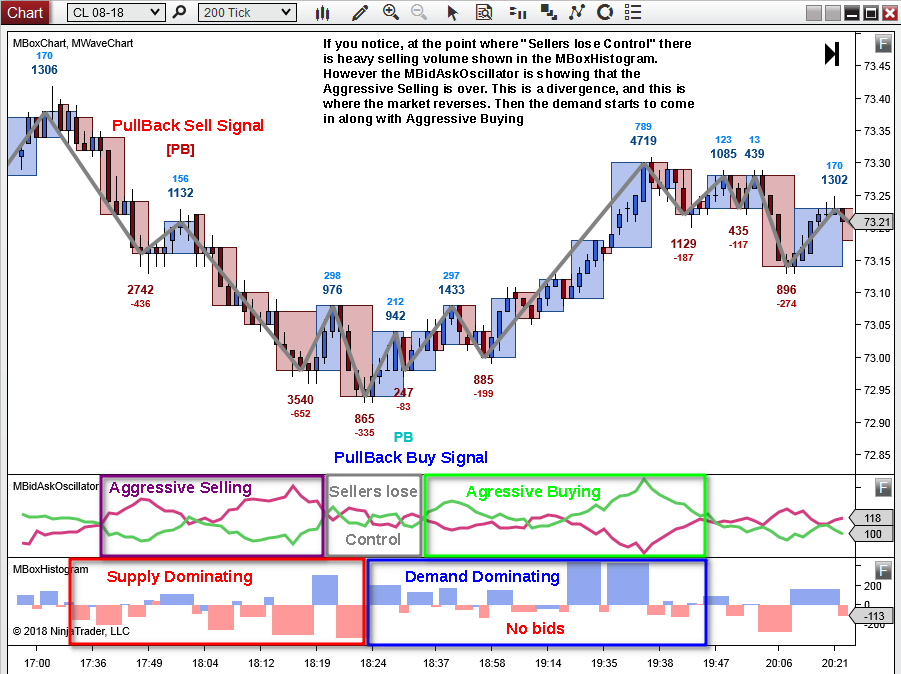
Example 1: Crude Oil - 200 Tick Chart
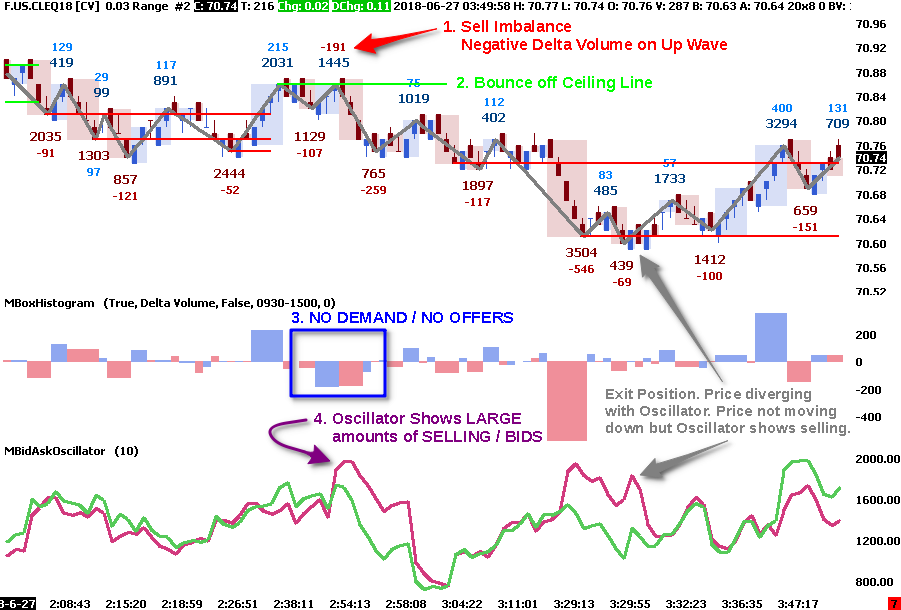
Example 2: Crude Oil - 3 Range Chart
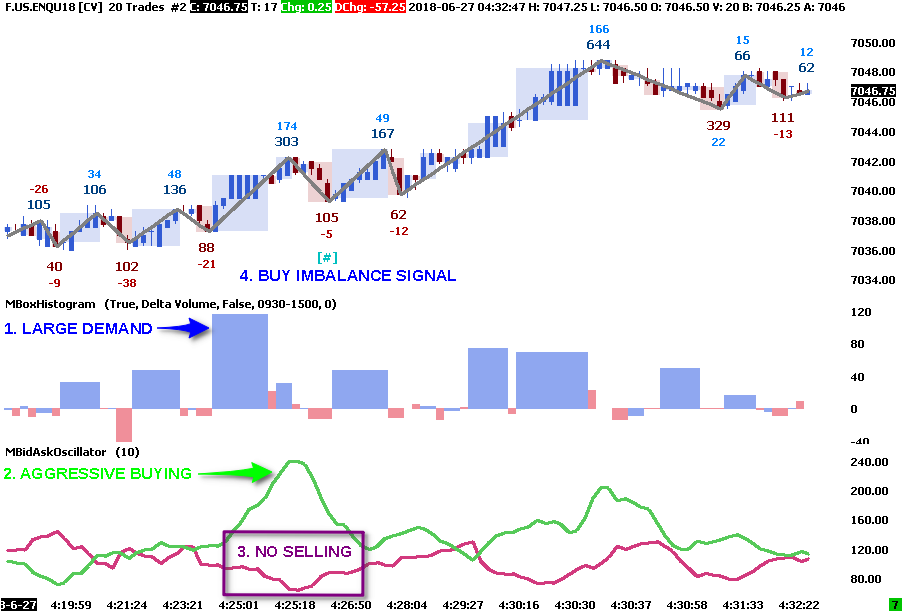
Example 3: Nasdaq - 20 Tick Chart
Example 4: Netflix - 200 Tick Chart
Example 5: Facebook - Daily Chart
Example 6: FOREX - EUR/USD 1 Minute Chart
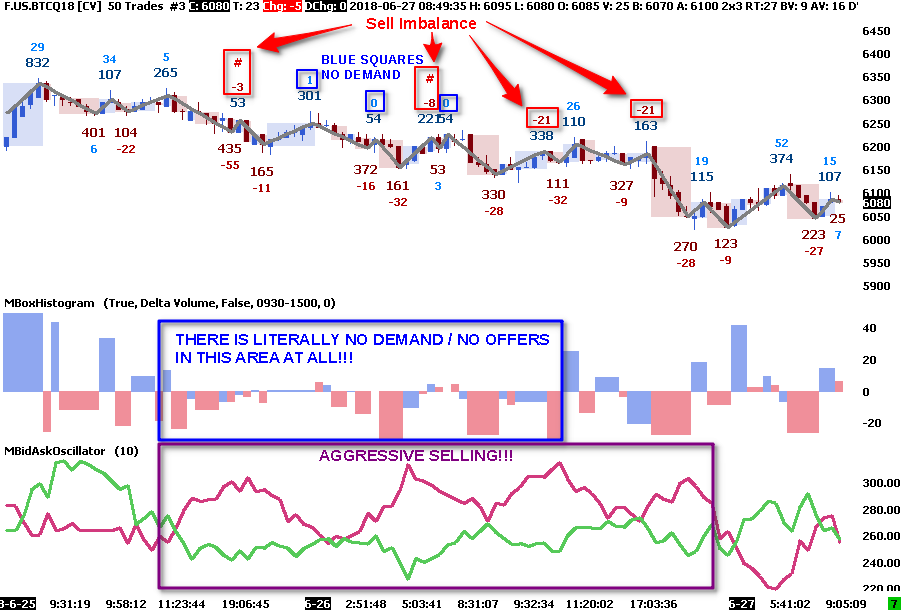
Example 7: Bitcoin - 50 Tick Chart