Indicator Settings for MultiCharts
The MboxWave Wyckoff Trading System for MultiCharts consists of the following indicators. Each section will explain all of the indicator options.
- MGannSwing
- MBoxChart
- MBoxHistogram
- MWaveChart
- MWaveHistogram
- MAutoFloorCeiling
- MCumulativeDelta
- MPace
- MBidAskOscillator
MGannSwing Indicator
This is the most Advanced wave indicator. The MGannSwing is a very powerful indicator depicting order flow and the constant battle between supply and demand very clearly.Technical details about how the MGannSwing works can be found on this page MGannSwing Indicator.
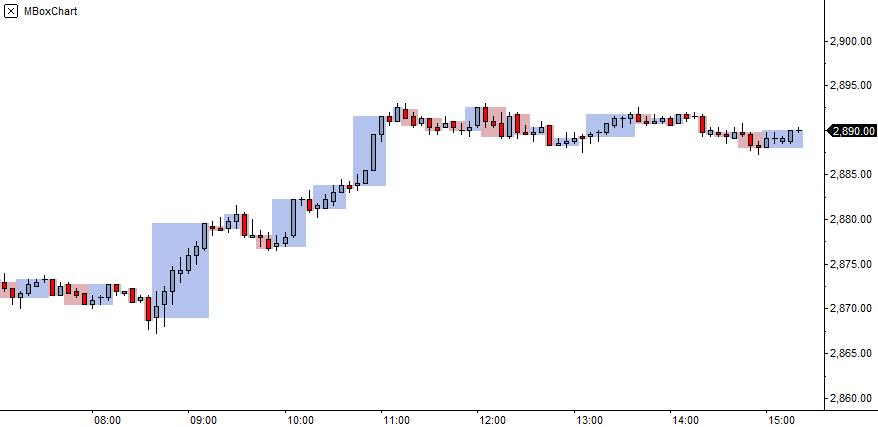
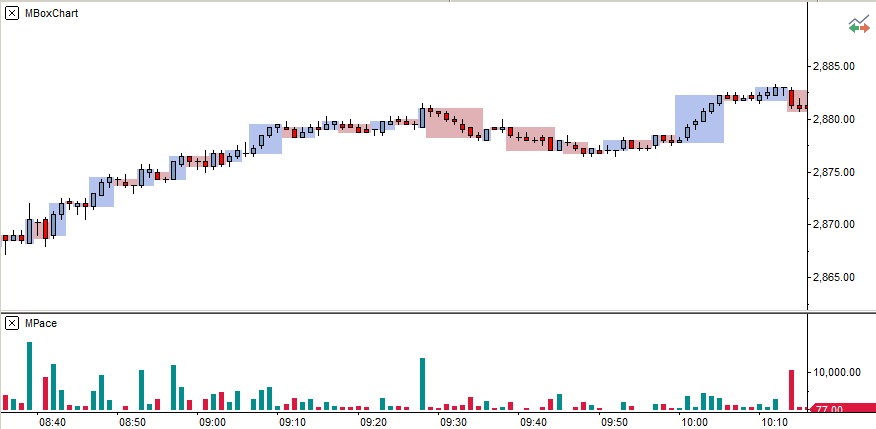
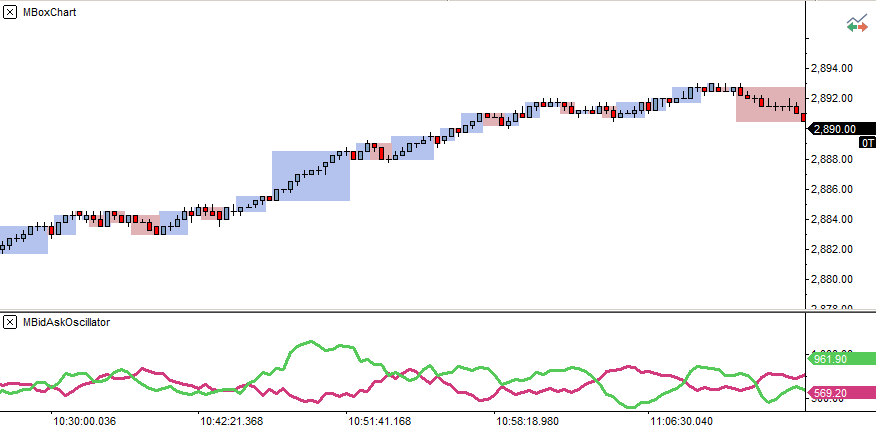
MBoxChart Indicator
This indicator is what draws the boxes on the chart. They are drawn in real time. The boxes are a mini wave, and allow you to see them on the chart really well.
MBoxChart Example
 |
|
A box encompasses upbars or downbars. They are mini waves. The main characteristics of a box are height and width. The height represents the length of the wave. The width has a correlation to either volume or time, depending on the type of chart we are looking at. If you use a volume chart then the width will equal the volume. If using a tick chart the width shows how much effort (number of bars in box) were drawn to form that wave and the progress made. The boxes are a really good way to visually see which way the market is going. When there are more red boxes that are longer and bigger than the blue boxes, price tends to go down. When there are more blue boxes, the opposite is true. |
MBoxChart Parameters
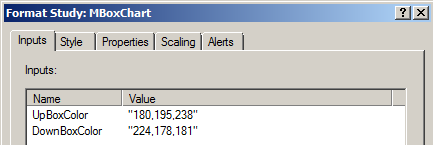 |
• Colors must be set using the RGB format. For a list of colors, check the TradeStation Colors page.
|
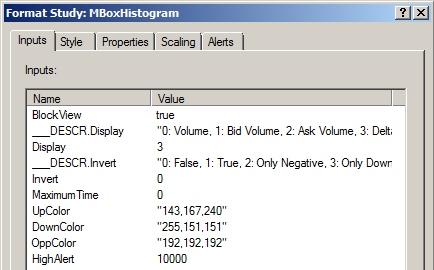
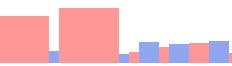
MBoxHistogram Indicator
This indicator draws the histogram that correlates to the boxes drawn by MboxChart.
MBoxHistogram Example
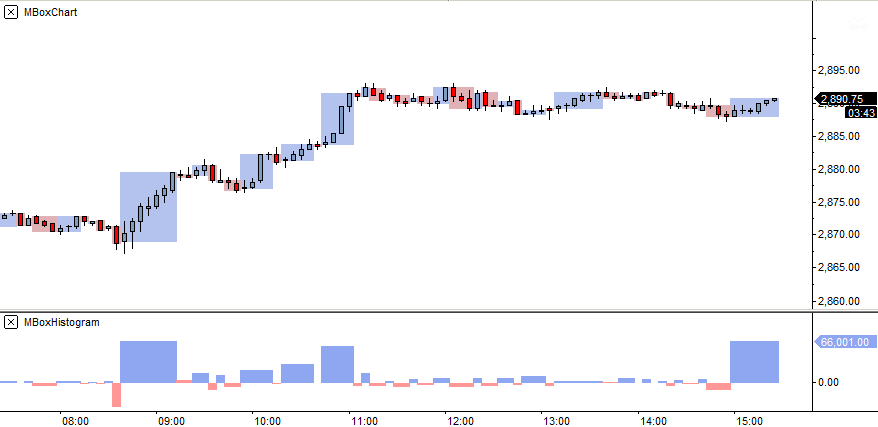 |
MBoxHistogram Parameters
|
|
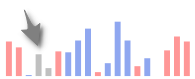
• Block View: If set to true, this will draw the histogram in blocks. • Display: You can choose what the histogram will show. The selection is numerical. You can choose 0: Volume • Invert: The selection is numerical. You can choose 0: False - Does nothing. Example viewing Delta Volume, Invert set to False Example viewing Delta Volume, Invert set to Only Negative It should be noticed , where the grey arrow is pointing that there is negative delta volume on an upbox. When Invert is set to Only Negative and we have negative delta volume on an upbox, or positive delta volume on a downwave, those bars in the histogram will be painted grey to be able to discern this. This color can be changed in "Opposite Volume Color". • Maximum Time: Filters time. If time for a wave exceeds set amount in seconds, time • Colors: Must be set using the RGB format. For a list of colors, check the TradeStation Colors page. • High Alert: An alert will be triggered if the histogram exceeds set amount. Need to enable in Alerts tab |
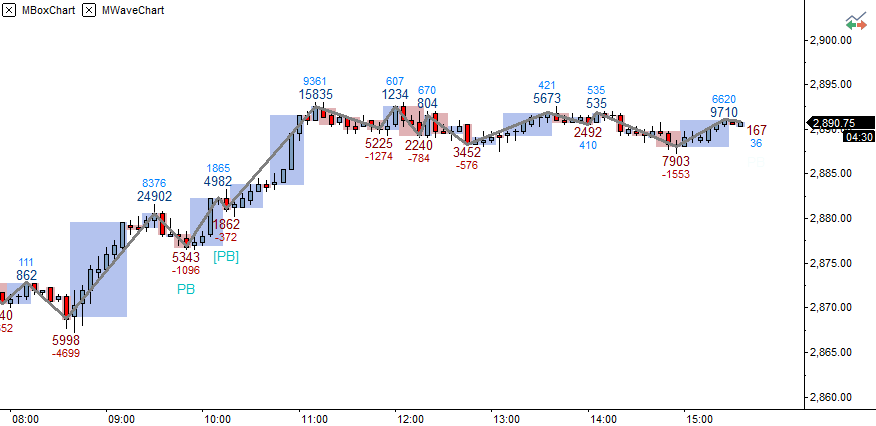
MWaveChart Indicator
This indicator draws the wave lines up and down and can display up to 2 different labels on each wave.
MWaveChart Example
 |
|
In this example the primary label (big text) shows volume and the second label (small text) shows delta volume. The wave calculates and is updated in real time. Here, the Pullback signals have been enabled and you can see them with the PB and [PB] labels. |
MWaveChart Parameters
|
|
• Primary Label - What is displayed in the primary label. The selection is numerical. You can choose 0: Volume • Second Label - What is displayed in the second label. The selection is numerical. Same as primary label. • Primary Divisor - If you want to show the the label in a more tidy manner, use the divisor. • Second Divisor - If you want to show the label in a more tidy manner, use the divisor. • Calculation Mode - Use Ticks or Percent to calculate wave formation. The selection is numerical 0: Ticks • Reversal Amount - Enter the number in Ticks or Percent to determine when a new wave forms. The amount entered must be exceeded. Example: For a 3 tick reversal wave enter 3. This means after 3 ticks have been exceeded a new wave will be drawn. For a 5% percent reversal wave enter 5. • Label Offset. Adjust the offset of the labels. You would typically only do this when loading multiple instances of MWaveChart on the same chart. • Algo Selected: Select which signals you want to display on the chart. The selection is numerical 0: None • Visual Parameters: Color must be set using the RGB format. For a list of colors, check the TradeStation Colors page.for the labels and waves. |
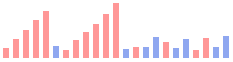
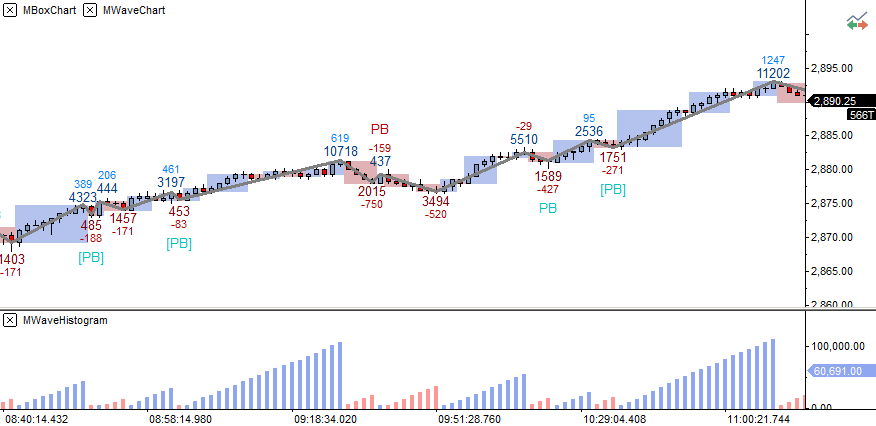
MWaveHistogram Indicator
This indicator draws the histogram that correlates to the zig zags.
MWaveHistogram Example
Showing wave volume in the histogram
 |
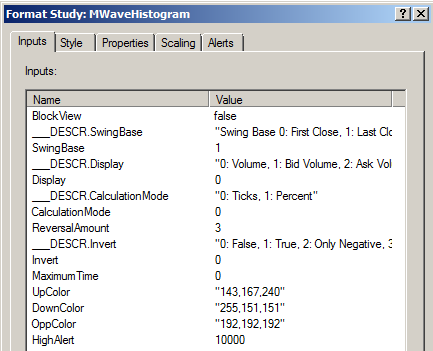
MWaveHistogram Parameters
|
|
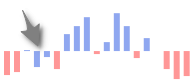
• Block View: If set to true, this will draw the histogram in blocks. • Display: You can choose what the histogram will show. The selection is numerical. You can choose 0: Volume • Calculation Mode - Use Ticks or Percent to calculate wave formation. The selection is numerical 0: Ticks • Reversal Amount - Enter the number in Ticks or Percent to determine when a new wave forms. The amount entered must be exceeded. Example: For a 3 tick reversal wave enter 3. This means after 3 ticks have been exceeded a new wave will be drawn. For a 5% percent reversal wave enter 5. • Invert: The selection is numerical. You can choose 0: False - Does nothing. Example viewing Delta Volume, Invert set to False Example viewing Delta Volume, Invert set to Only Negative It should be noticed , where the grey arrow is pointing that there is negative delta volume on an upbox. When Invert is set to Only Negative and we have negative delta volume on an upbox, or positive delta volume on a downwave, those bars in the histogram will be painted grey to be able to discern this. This color can be changed in "Opposite Volume Color". • Maximum Time: Filters time. If time for a wave exceeds set amount in seconds, time • Colors: Must be set using the RGB format. For a list of colors, check the TradeStation Colors page. • High Alert: An alert will be triggered if the histogram exceeds set amount. Need to enable in Alerts tab |
MAutoFloorCeiling Indicator
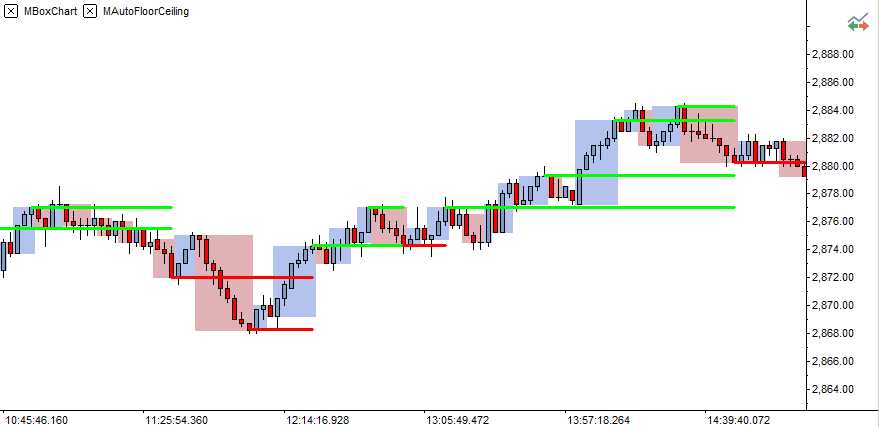
MAutoFloorCeiling Example
 |
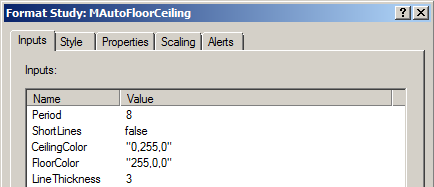
MAutoFloorCeiling Parameters
|
|
Check out the page MAutoFloorCeiling Indicator for how to use this indicator. • Period: Controls how many previous bars are analyzed when drawing the automatic support and resistance lines. A smaller period will draw more lines. A larger period will draw less, but they will be longer. Fibonacci numbers tend to be good periods. You can try 3, 5, 8, 13, 21, 34, 55. • Colors: Must be set using the RGB format. For a list of colors, check the TradeStation Colors page. |
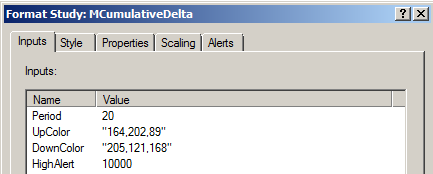
MCumulativeDelta Indicator
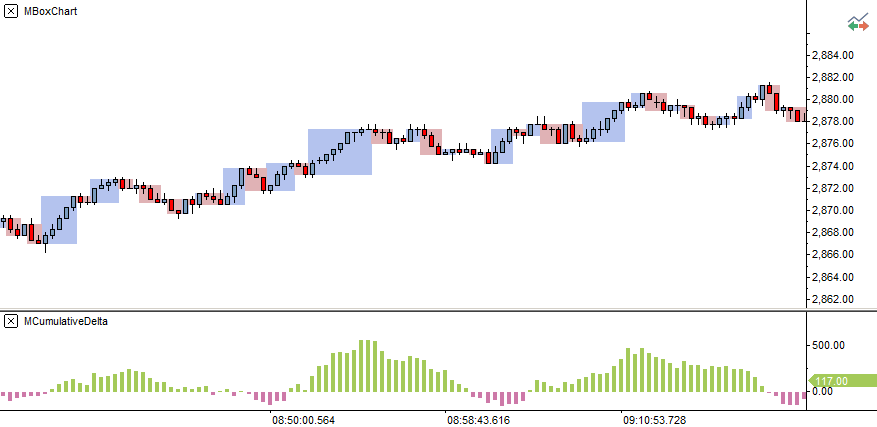
MCumulativeDelta Example
 |
MCumulativeDelta Parameters
|
|
Check out the page MCumulativeDelta Indicator for how to use this indicator. • Period: Controls how many previous bars are analyzed when determining the cumulative delta in the histogram. A smaller period will cause the histogram to react faster. A larger period will have more smoothing and a slower reaction in the histogram. Some numbers to try for periods can be 13, 20, 55, 200 (long term). • Colors: Must be set using the RGB format. For a list of colors, check the TradeStation Colors page. • High Alert: An alert will be triggered if the histogram exceeds set amount. Need to enable in Alerts tab |
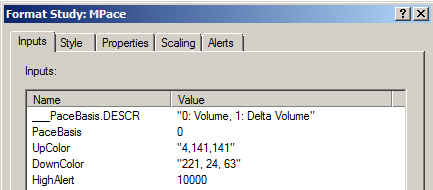
MPace Indicator
MPace Example
 |
MPace Parameters
|
|
Check out the page MPace Indicator for how to use this indicator. • Pace Basis: Controls how the pace is calculated and displayed in the histogram. The selection is numerical. 0: Volume • Colors: Must be set using the RGB format. For a list of colors, check the TradeStation Colors page. • High Alert: An alert will be triggered if the histogram exceeds set amount. Need to enable in Alerts tab |
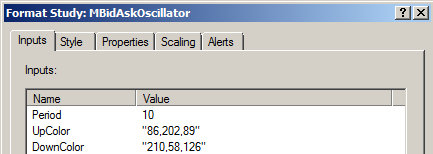
MBidAskOscillator Indicator
MBidAskOscillator Example
 |
MBidAskOscillator Parameters
|
|
Check out the page MBidAskOscillator Indicator for how to use this indicator. • Period: Controls how many previous bars are analyzed to calculate the bid / ask lines in the oscillator. • Colors: Must be set using the RGB format. For a list of colors, check the TradeStation Colors page.
|