XKontrol IndicatorIs a visual representation of who is in Kontrol relative to the Tape Speed of the Floor. The XKontrol indicator will show you who is in Kontrol, the BIDS or the OFFERS. This is a very powerful indicator. Great for long term plays and a *SCALPERS* paradise. * WHAT THE INDICATOR DOES * * HOW IT WORKS * * HOW TO USE IT * Usually XKontrol is used in conjunction with XPace, as XKontrol deciphers the Tape Speed of the Floor and draws graphical dots to show whether the BIDS or the OFFERS are dominating right on the chart. Reading XPace will show visually in the histogram the strength of the BID and OFFER Kontrol in the histogram. * WHAT MAKES IT ORIGINAL * XPace IndicatorOriginal indicator MPace measures the Tape Speed of the Floor. XPace is a significant enhancement of MPace, making it even easier to see the pace that is important, while filtering out the noise. The XPace indicator represents a histogram view of the Tape Speed of the Floor. The Tape Speed (aka Pace) is represented as red and green bars drawn in a histogram view. As the red histogram bars grow larger and increase in frequency, this shows that the BIDS are in kontrol at that time. And conversely, when the green histogram bars grow larger and increase in frequency, this shows that the OFFERS are in kontrol. Weighing in whether the BIDS or OFFERS are in kontrol can be a helpful indicator to decide what direction the market could move in. What is helpful about XPace is that it will show you the raw value of the BID and OFFER kontrol. This can be combined with XKontrol which will classify the kontrol as either Initial, Strong, and Total. Using these 2 indicators combined has added value. * WHAT MAKES IT ORIGINAL * |
* USE CASES *
Some practical examples of using XKontrol + XPace combined could be the following:
1. XKontrol Large Green Dot + XPace Large Green Bar could be that the OFFERS have gained total kontrol and are dominating against the Bids. Once would want to watch for higher prices to be potentially reached after that.
2. XKontrol Small Red Dot + XPace Large Red Bar could be that there was a lot of effort on behalf of the BIDS, but they failed to achieve any significant kontrol. The small red dot in XKontrol represents only initial kontrol which is weak kontrol. An application would be to watch for a potential break out on the up side and that will confirm that the BIDS overexerted their effort and was oversold.
3. XKontrol Red and Green Dots mixed could show that it has not been decided whether the BIDS or OFFERS are dominating and the outlook is neutral. If the XPace histogram bars don't stand out either, it would add another point for a neutral analysis.
* EXAMPLES *
Video Examples of XPace / XKontrol on the Youtube page MBoxWave Live Trade Videos
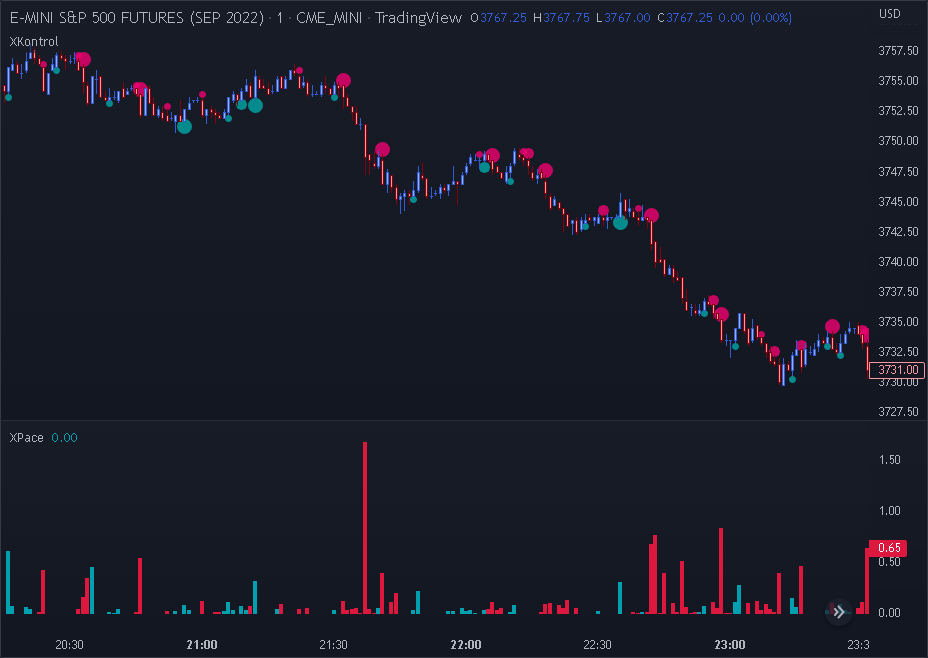
Example 1: ES - 1 Minute Chart
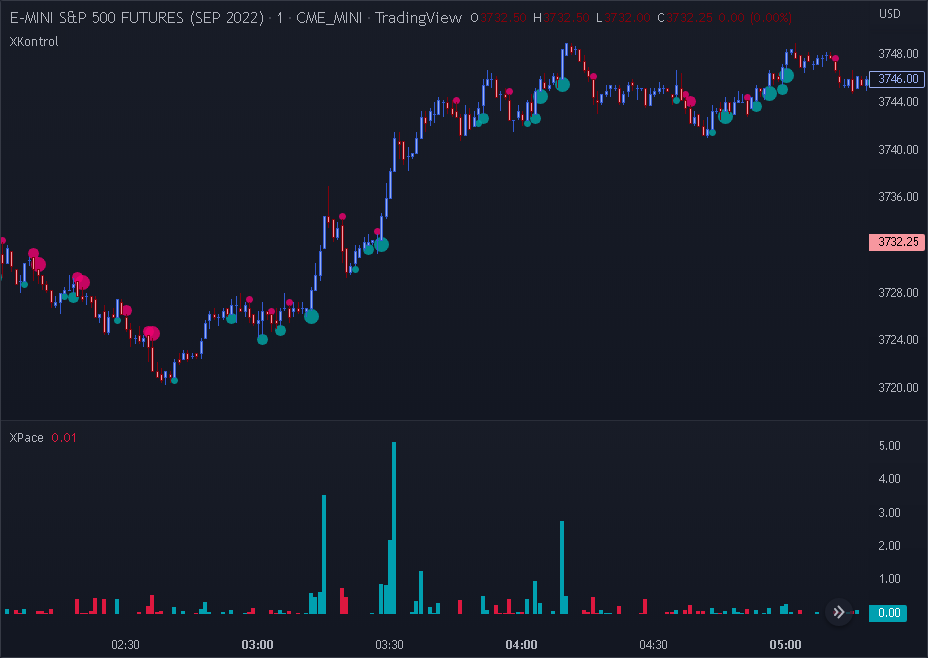
Example 2: ES - 1 Minute Chart
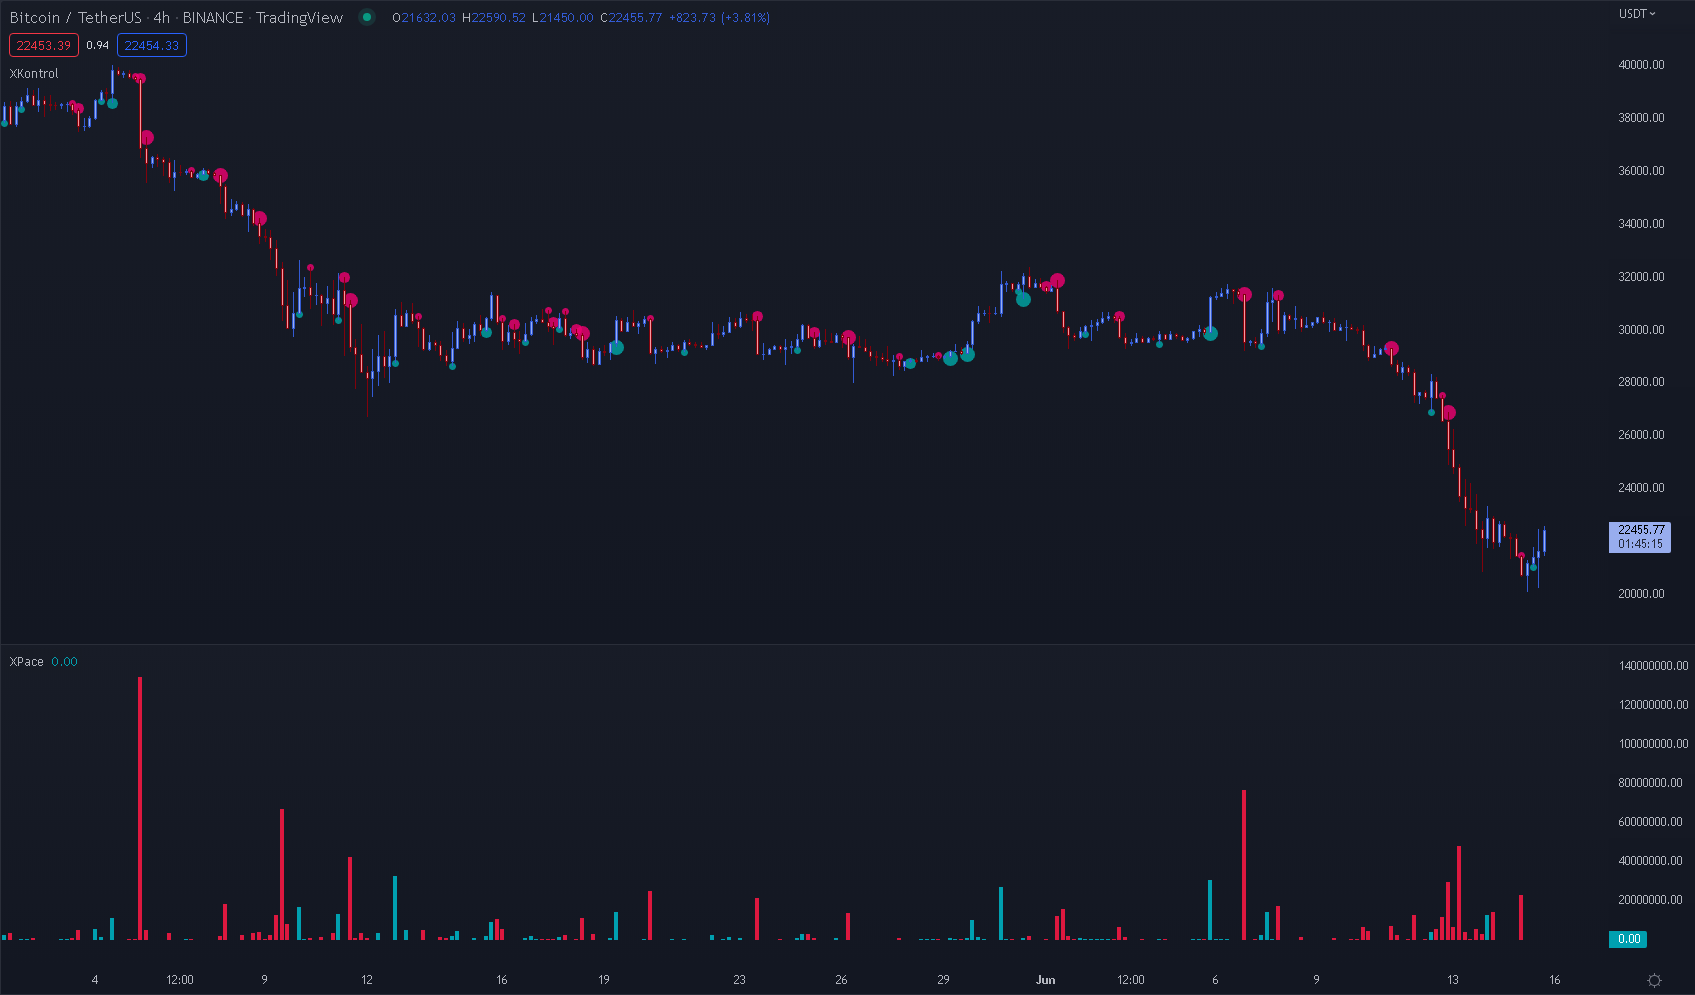
Example 3: Bitcoin - 4H Chart
Example 4: ETH - 4H Chart

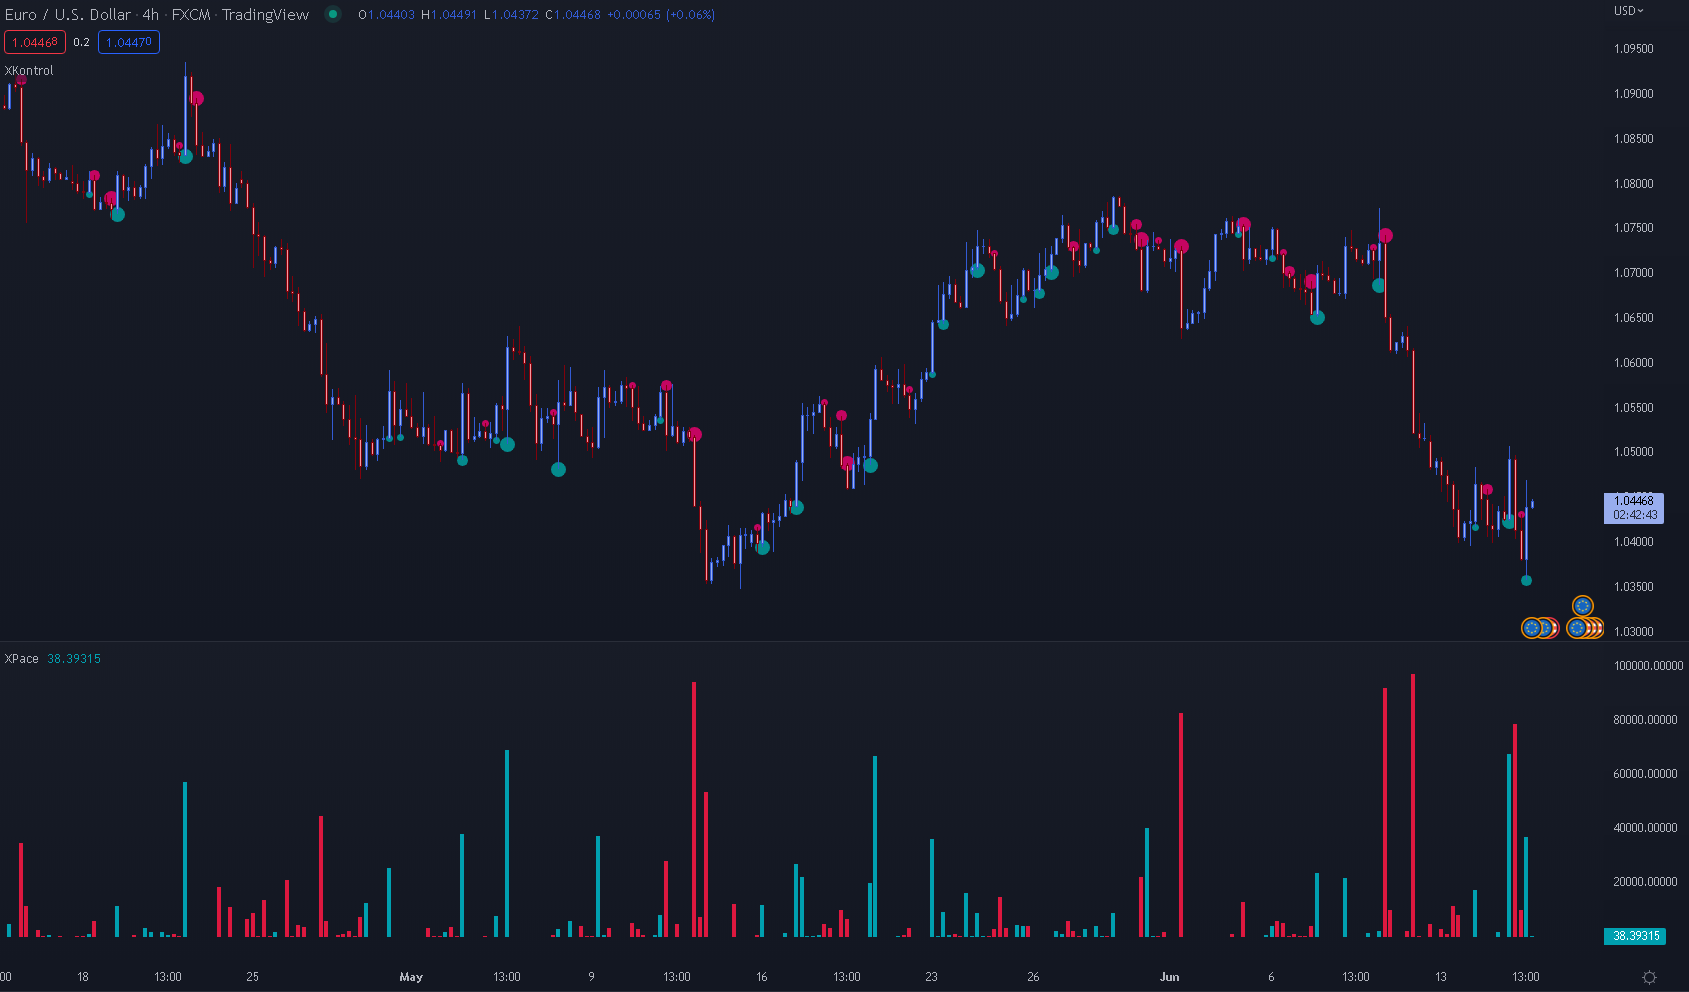
Example 5: FOREX - EUR/USD - 4H Chart
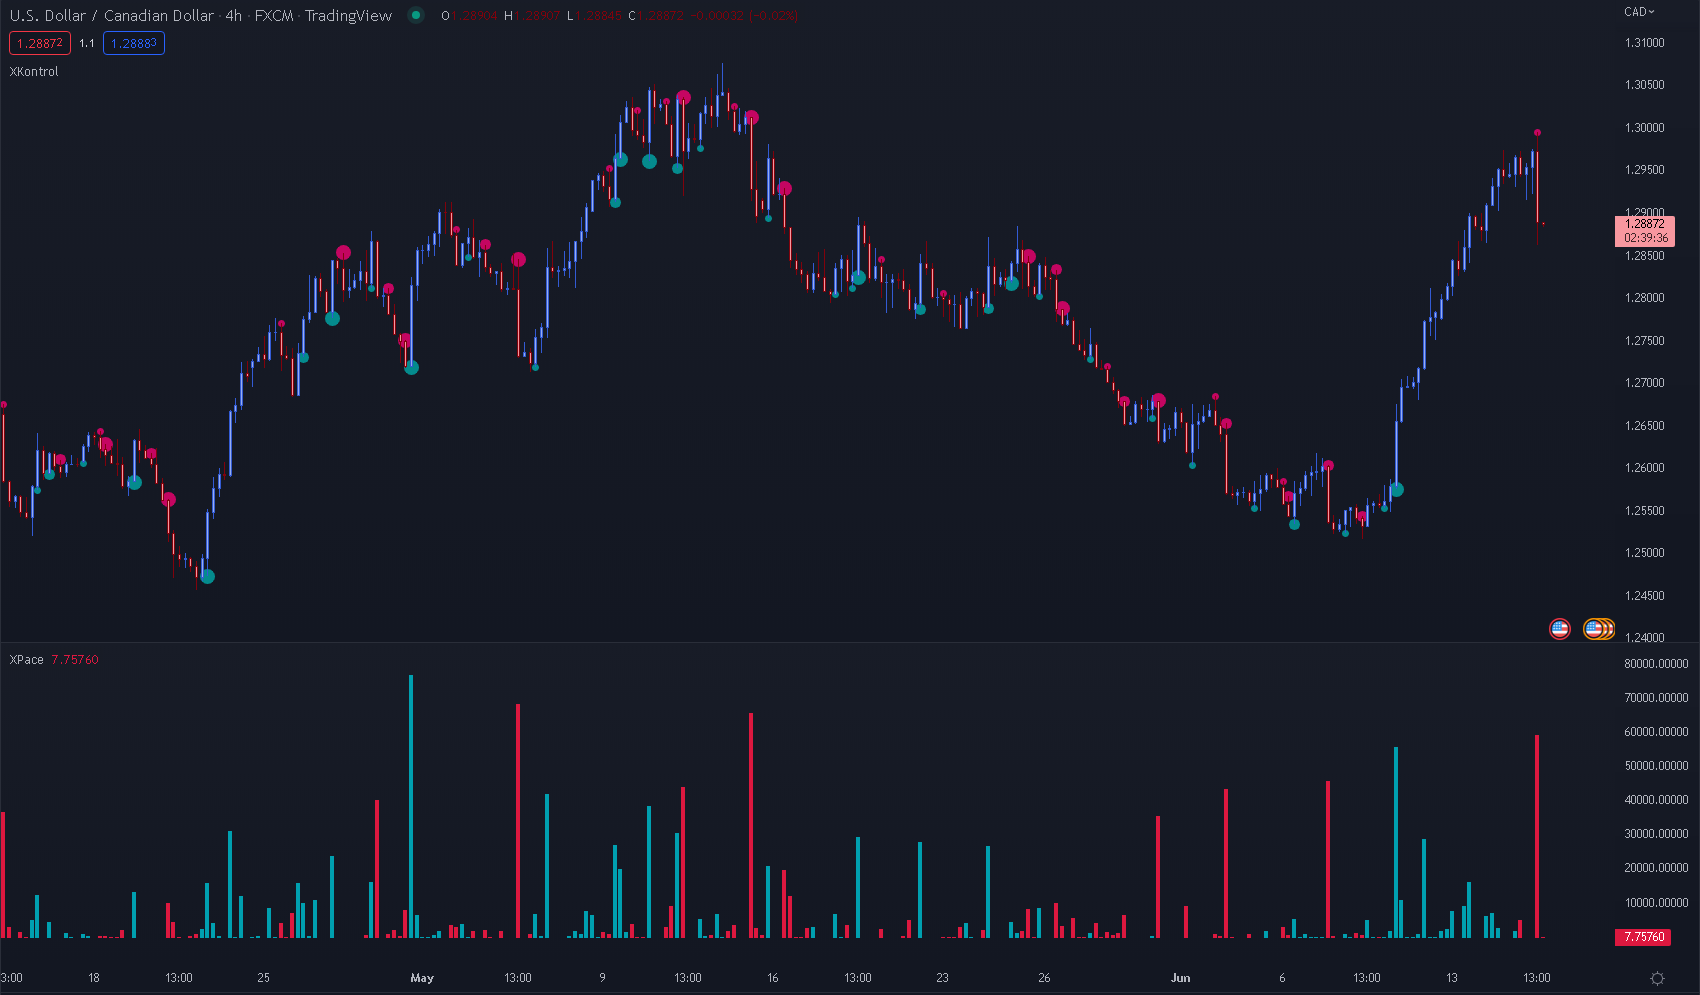
Example 6: FOREX - USD/CAD - 4H Chart
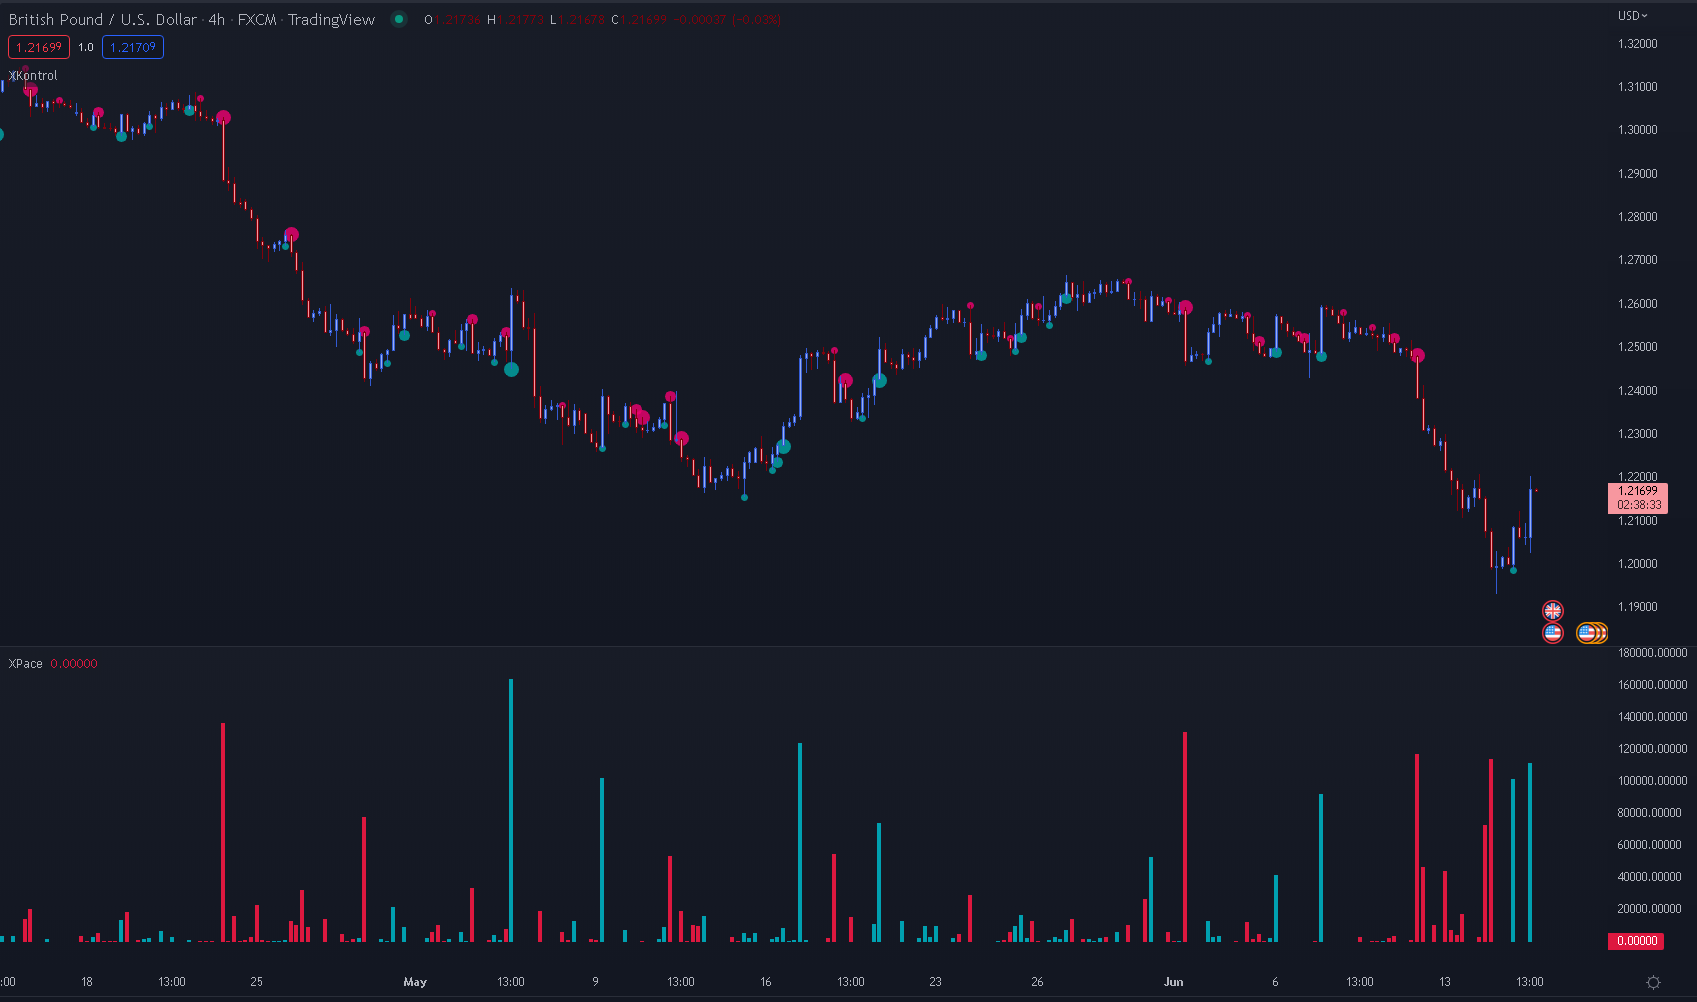
Example 7: FOREX - GBP/USD - 4H Chart
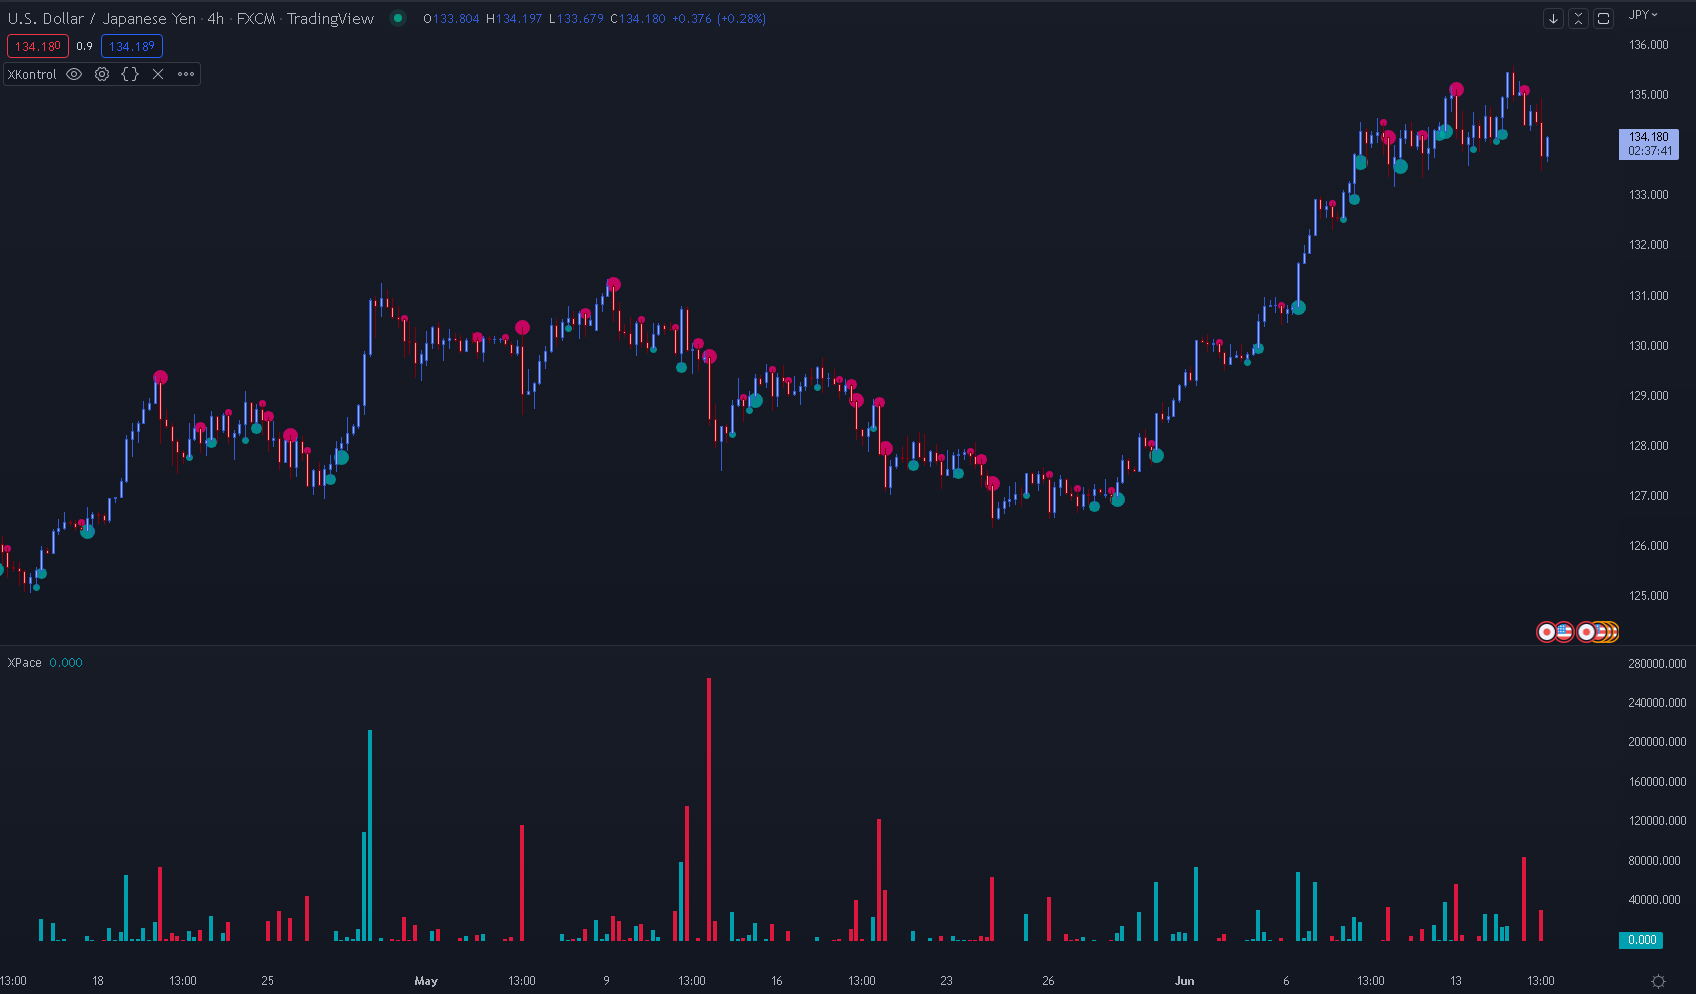
Example 8: FOREX - USD/JPY - 4H Chart